

The largest industry segment is single aisle jetliners. Deliveries increased by more than 40% in 2021 and will increase another 40+% in 2022. This is largely driven by the very strong domestic market recovery we’ve seen in North America and China. Also, there’s the impact of Boeing 737 MAX production and deliveries resuming, with a goal of 31 new build jets per month next year, in addition to deliveries of already-built MAXs.
Airbus, meanwhile, is aiming for record single-aisle rates. A320 family output was cut to 40 per month during the pandemic, but the manufacturer delivered 58 in November 2021. It’s aiming for a monthly rate of 64 by mid-2023 and possibly 70 to 75 in the following years.
Twin aisle jets are the only exception to this positive view. There was a widebody overcapacity problem before the pandemic. Also, this segment depends on international air traffic, which was hit hardest and is taking longest to recover. Meanwhile, the pandemic saw an acceleration in the shift toward single aisles, particularly Airbus’ A321neo, for international routes.
Some of the planes in our recovery forecast don’t involve new manufacturing. This year will see deliveries of scores of 787s and hundreds of 737 MAXs that were already built, so the supplier base won’t benefit much from them. Inflation could also impact supplier profitability. If inflation persists, interest rates will rise, impacting jetliner financing. If the Omicron variant or another COVID variant causes shutdowns, closed borders and another air traffic slump, some airlines and suppliers could prove unable to withstand another major crisis.
But as of this writing, the COVID-19 aviation downturn looks set to be remembered as shorter-lived and more sector-specific than originally feared. After falling off a cliff, the industry is heading sharply up.
Figure X: World Aircraft Deliveries by Value
Source: AeroDynamic Advisory

The Carbon Fiber Market
By Dr. Sanjay Mazumdar, CEO
Lucintel
Carbon fiber has come a long way over the years, impacting almost every market from aerospace to automotive and sporting goods. The key advantages of carbon fiber are high tensile strength, high stiffness, low density and a high chemical resistance, which lead to increased utilization in various sectors. Between 2010 and 2019, the carbon fiber industry experienced uninterrupted growth, with demand increasing from 82.3 million pounds in 2010 to more than 192 million pounds ($2.6 billion) in 2019.
Then in 2020, the COVID-19 pandemic caused unprecedented disruption, with the overall carbon fiber industry declining 9.7%. At the beginning of 2021, the carbon fiber industry performed well and showed positive signs. However, by the end of the year, overall carbon fiber demand grew only 4.4% due to supply chain issues and lower demand from the aerospace and automotive industries. Increasing wind turbine installations and growing demand of premium sports equipment were key driving factors for the carbon fiber industry last year.
Aerospace, one of the major end users of carbon fiber, was affected severely in 2020 and 2021. Before the pandemic, the Airbus A350 and Boeing 787 Dreamliner were built at a rate of 12 and 14 per month, respectively. However, due to travel bans and other COVID-related crises, production of these aircrafts dropped to two and three per month in 2021. As a result, carbon fiber demand for aerospace declined 33% in 2021 after a huge drop of 46% in 2020.
Lucintel forecasts that the demand for global carbon fiber in 2022 will increase by about 2.6% due to slow recovery in the aerospace market and slower growth in the wind market in 2022, where demand for carbon fiber-reinforced polymers grew by double digits in 2020 and 2021. However, there are plenty of new opportunities emerging. Lucintel sees immense prospects for carbon fiber in three areas: urban air mobility, hydrogen storage and fuel cells. Related technologies and applications are at the nascent stage but offer huge potential for future growth.
Urban Air Mobility (UAM)/Air Taxis – Increasing urban populations will lead to road congestion and demands for competitive modes of transport that can reduce traffic issues and save journey time. Electric vertical takeoff and landing (eVTOL) vehicles – or air taxis – are one future mode of transport that will rely on CFRP parts for structural and interior components.
Pressure Vessels for Hydrogen Storage – Greater emphasis on decarburization is driving demand for hydrogen-based fuels. Hydrogen storage tanks are used in transportation (car, trucks, rail, aerospace, etc.), distribution (mobile pipelines) and hydrogen refueling stations. Pressure vessels (Type IV) for hydrogen storage are gaining use in the automotive and aerospace industries. Carbon fiber composites are the ideal material for making Type IV and Type V pressure vessels. However, the high cost of carbon fiber is a challenge in these applications, especially if demand for hydrogen tanks grows rapidly.
Fuel Cells – Increasing demand for portable devices and interest in hydrogen fuel cell vehicles in developing countries are driving fuel cell demand. Carbon fiber composites are used in key components of fuel cell stacks. Major components such as bi-polar plates and gas diffusion layers are being made using CFRP, which not only reduces the system weight and part counts but also increases mechanical strength and corrosion resistance.
These and other emerging applications will continue to drive the growth of carbon fiber as end users seek the performance benefits of the material’s high strength and stiffness characteristics.
Figure X: 2021 Market Share of CFRP Parts’ Manufacturing Processes
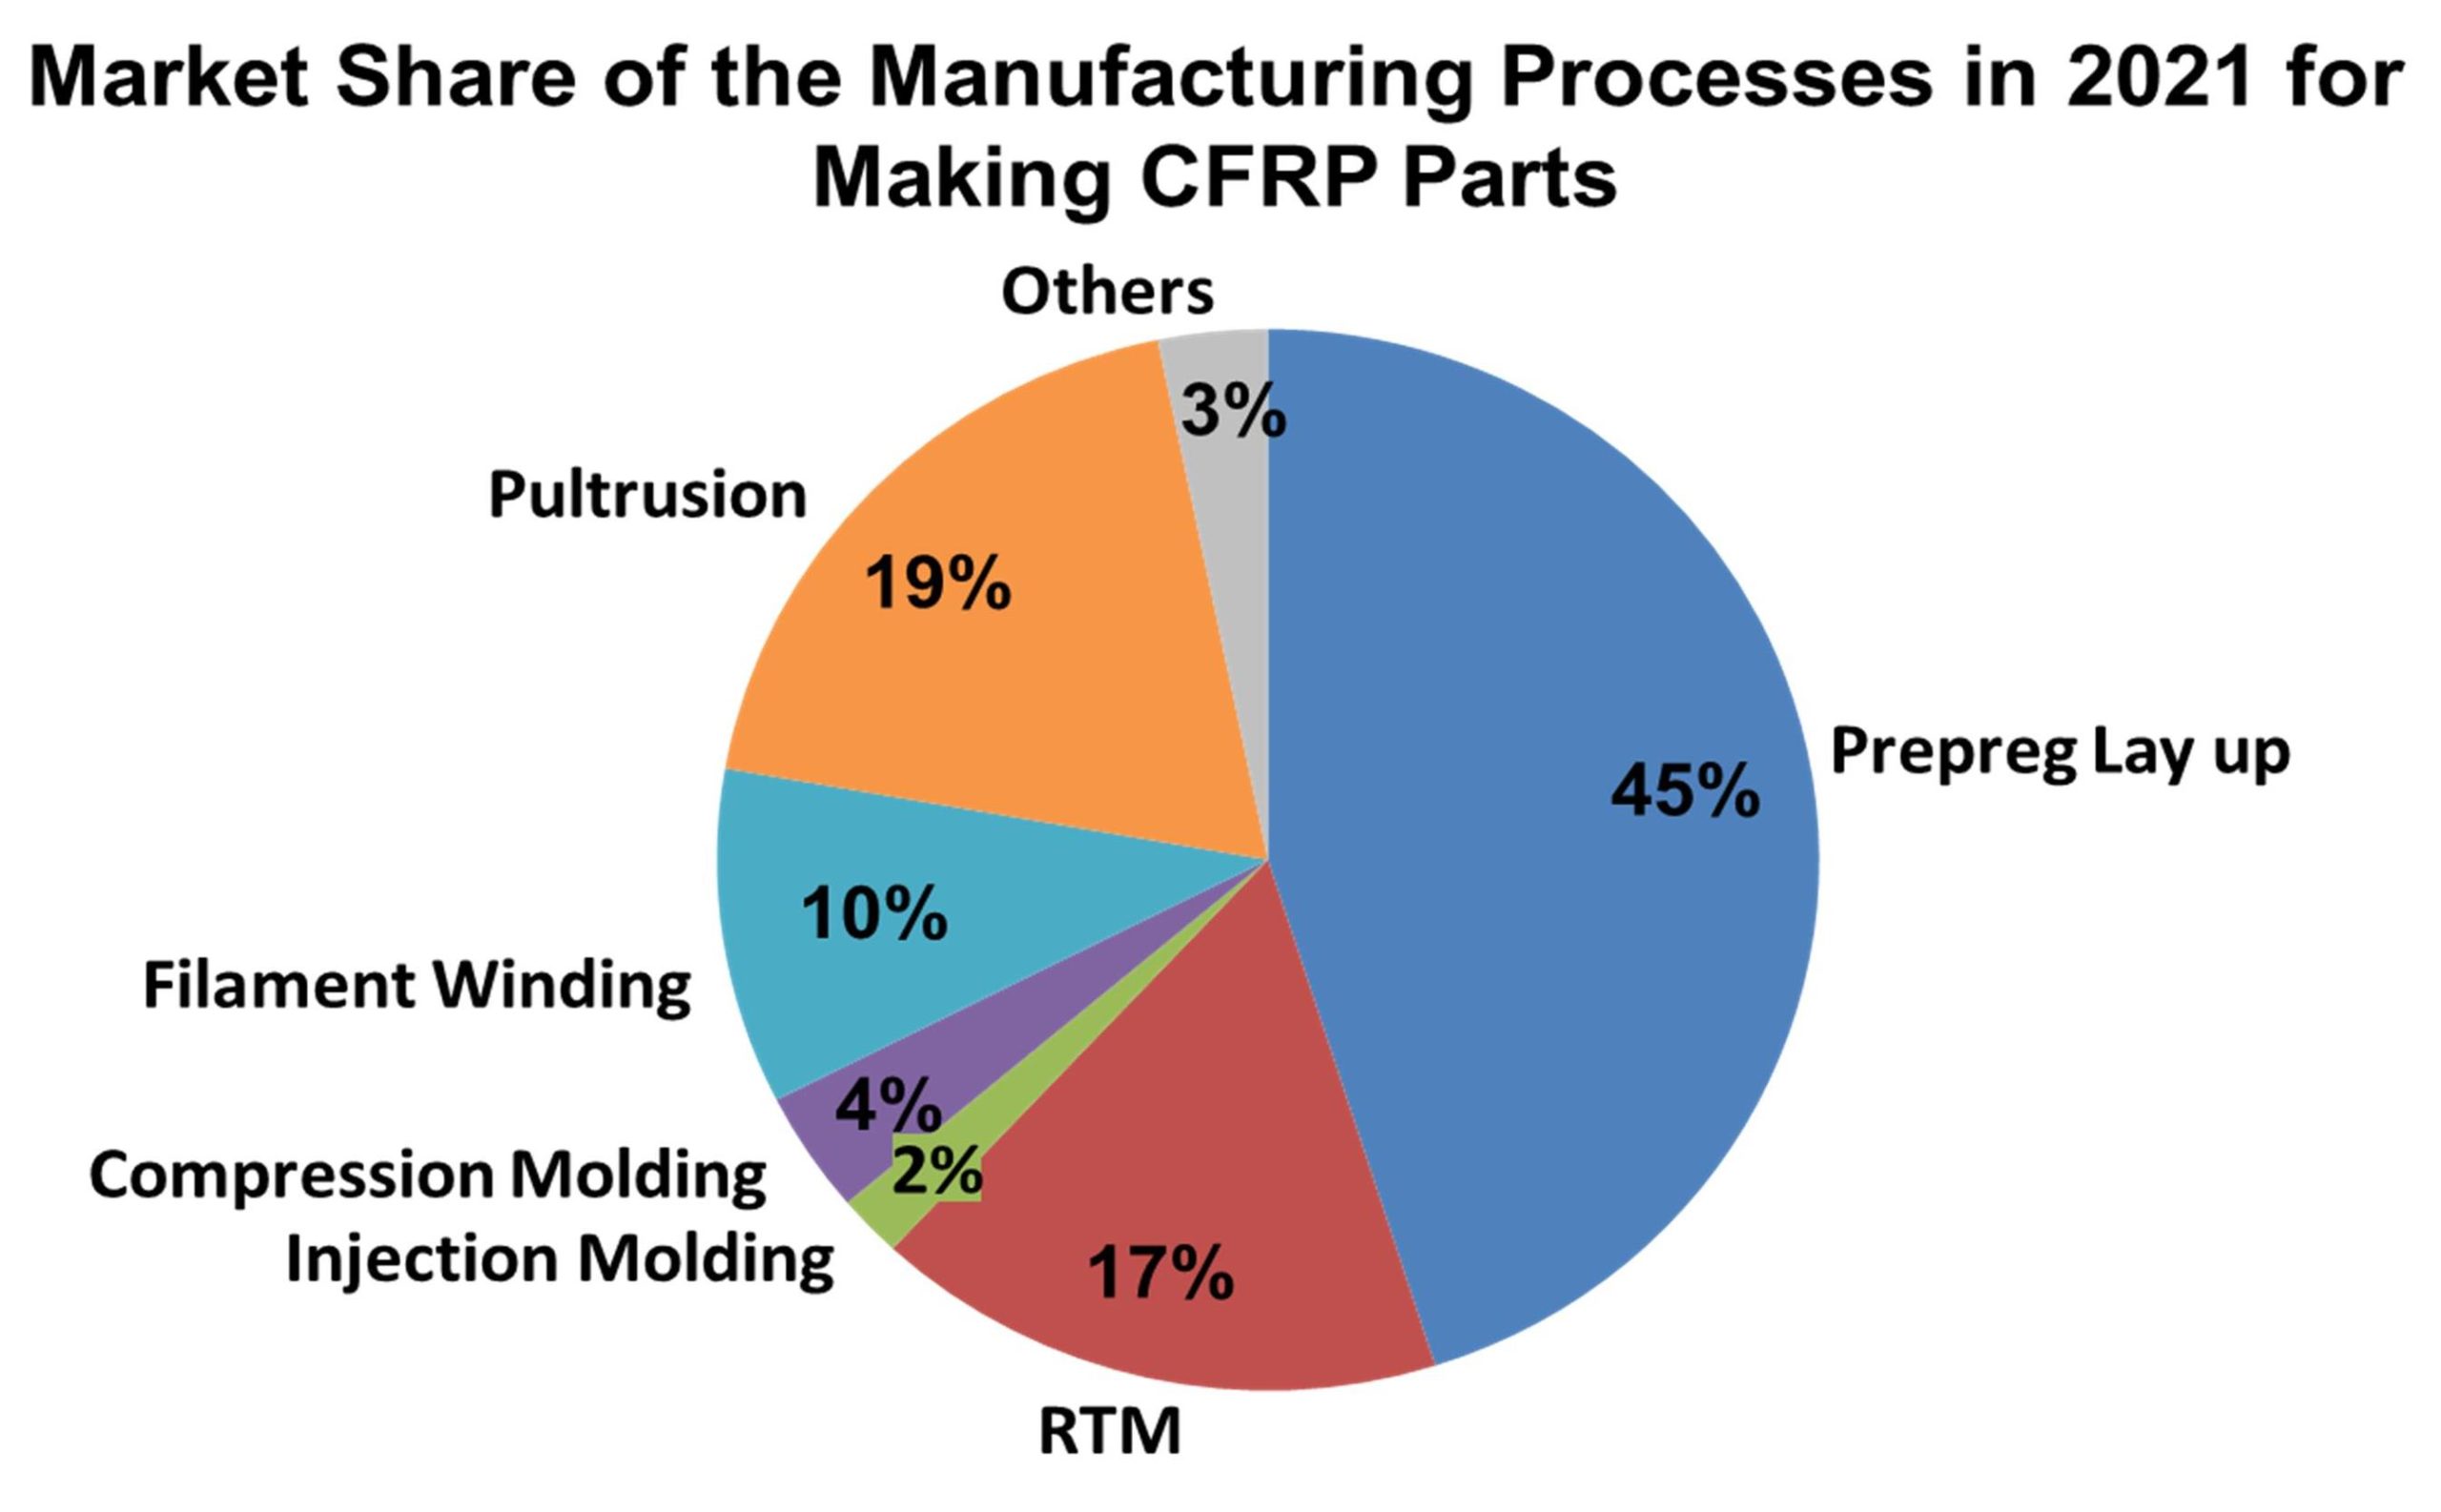
Source: Lucintel
The Construction/Infrastructure Market
By Ken Simonson, Chief Economist
Associated General Contractors of America
Construction professionals and suppliers have reason to be optimistic about their prospects in 2022. But they can expect plenty of hurdles to overcome along the way.
The grounds for optimism reflect a recent pickup in several private nonresidential categories, enactment of the largest-ever federal infrastructure funding bill and continuing demand for both single and multifamily housing. Each of these sectors should contribute to growth in 2022.
In 2021, most types of nonresidential construction spending trailed 2020 levels until late in the year, aside from robust gains in distribution and data center structures. By year end, however, groundbreaking had occurred or been announced for numerous manufacturing facilities. Manufacturing expansion will continue to bulk up contractors’ order books in 2022. The industry can also expect a modest upturn in retail, office, hotel and leisure-related spending, although the timing for these segments will vary by region and will depend on the level of coronavirus outbreaks.
Infrastructure spending is heading for major expansion but mostly not before late 2022 or beyond. Highway spending may ramp up promptly since the funds will flow through established channels, much of it under existing allocation rules. In contrast, funding for categories such as broadband and electric vehicle charging will require setting up procedures for applying for and choosing projects. Once selected, projects will likely require more time to order and produce materials and assemble and train workers.
The construction/infrastructure industry must cope with three main challenges: labor availability, supply chain bottlenecks and materials costs. Each was an issue in 2021 as well, but the severity of the impediments they will present in 2022 will vary by firm.
Like other sectors, construction experienced record levels of job openings in late 2021. But two factors make filling positions especially tough. First, an ongoing survey by the Delphi Group at Carnegie Mellon University of individuals by coronavirus vaccination rate has consistently found that respondents who identify their occupation as construction have a much lower vaccination rate (57% as of late November) than other occupations (83%). As more owners require all personnel on their premises to be vaccinated, contractors are likely to have greater difficulty than in 2021 fielding full, healthy and eligible teams.
Second, the wage premium that construction has paid relative to other sectors has eroded sharply since the pandemic struck, while some other industries have improved working conditions as well as pay. From 2006 to 2019, hourly earnings for craft workers and other “production and nonsupervisory employees” in construction averaged 20 to 23% more than for all other private sector employees. That premium shrank to less than 18% in 2020 and 2021 as historically low-wage industries such as fast food, warehousing and local delivery services dramatically increased hourly wages and added bonuses. In addition, some industries can offer flexible hours or work locations. As a result, construction firms are likely to have a harder time attracting and retaining workers unless they raise wages.
Supply chain problems include outright unavailability of some materials, extreme lead times on production and transportation bottlenecks. All these woes have affected the construction/infrastructure industry in 2021 and many will continue in 2022. However, manufacturing capacity is gradually coming online. And some shortages, such as the lack of numerous construction plastics attributable to the shutdown of resins plants in Texas caused by an extreme cold snap, will probably not recur.
Materials costs are likely to be volatile, but in both directions instead of rising across the board as in the first half of 2021. After hitting record levels in May through August 2021, futures or spot prices have dropped considerably for aluminum, copper, steel and petroleum products, implying that delivered prices for materials using these inputs will fall as well. However, the declines are unpredictable and subject to sudden reversals, as shown by the extreme ups and downs in lumber prices throughout 2021.
In summary, contractors will be busy in 2022. Firms selling goods and services to construction/infrastructure can expect plenty of demand. But firms hoping to get a project built by a firm date at a known price may be out of luck.
Figure X: Change in Construction Spending
Source: Author’s calculations from U.S. Census Bureau, www.census.gov/constructionspending
